

Please allow me to state the obvious: at its core, achieving real, sustained success in college football can be boiled down to getting the best players on your roster, and then maximizing on-field output during the short time they’re enrolled. That this statement is artlessly simple does not make it any less true (humor me, it’s the offseason). Plenty of ink has been spilled on how Notre Dame can attract more high-end talent through an enhanced recruiting operation (especially after the most recent class proved that luring high 4/5 star offensive skill position talent is no pipe dream). The Athletic’s recent piece that retroactively adjusted ND’s 2016 class from #15 to #4 nationally is further evidence that the talent development operation in South Bend is also functioning as it should.
Notre Dame’s unique place in the college football world feels somehow static and fluid at once — sure, there’s a bit less luster attached considering that minor detail of zero titles in over three decades, but it isn’t wrong to suggest that the program should be vying for a top ten finish more or less every year. But those are just feelings, and as this site has piously and helpfully documented, feelings can, uh, vary. Where do we stand, really, after 33 wins over three seasons? Is that the most we could be getting out of our rosters? Thankfully, 247 Sports provides team talent composite rankings by year so that we can put together a predictive reading of each program’s capabilities over time. And since their player ratings are on a 0-100 scale, we can use these subjective scores as a sort of benchmark against cold, hard wins and losses.
I plotted overall talent % vs. winning % for each individual squad that ranked in the top 25 of 247’s talent rankings from 2016-2019. Admittedly, this talent % is a tough one-to-one standard to meet — yeah, Alabama is a recruiting juggernaut, but are they really going to win 99% of their games? Let’s hope not — but I find this useful in evaluating how the richest of the college football rich have done in utilizing the talent they’ve brought in over a 4-year recruiting cycle. Let’s have a little chart party.
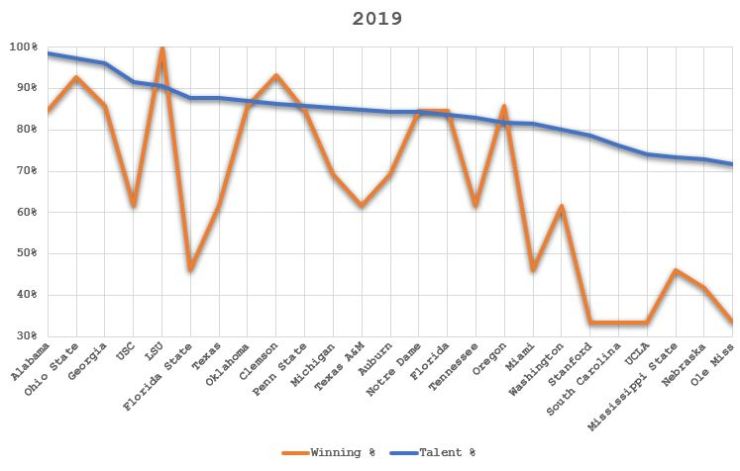
- Overachievers: LSU, Clemson, Oregon, Florida, Notre Dame (by 0.3%, still counts!)
- You’re bad and you should feel bad: Stanford (lol that is an absolute chasm), South Carolina (hey Georgia, wassup), Florida State, UCLA, Ole Miss, Miami, Nebraska, and Southern Cal (Claaaay) all won at rates that lagged behind their composite talent by more than 30%
2019 produced a nice little bunch of high performers in the top 15, but it was a notably bad year for teams on the low end of the rankings, as four “top” teams went 4-8. Turns out that weird, bad seasons don’t just happen to our preferred team.

- Overachievers: Clemson, Notre Dame, Oklahoma
- You’re bad and you should feel bad: Southern Cal (Claaaaaaaaaaay), UCLA (tough time for Los Angeles football), Florida State, Tennessee, Ole Miss, Maryland (feels wrong that they made the rankings in the first place)
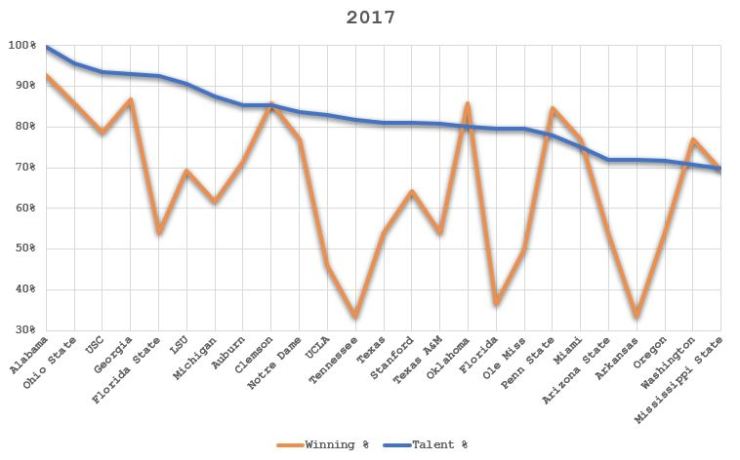
- Overachievers: Penn State, Washington, Oklahoma, Miami, Clemson
- You’re bad and you should feel bad: Tennessee, Florida (feels like a 2016 ND kinda deal, seeing as this is sandwiched between a handful of otherwise successful seasons), Florida State, Arkansas, UCLA

- Overachievers: Washington, Clemson, Oklahoma, Penn State
- You’re bad and you should feel bad: Notre Dame (51% variance! lost to two of the other worst offenders here! truly catastrophic!), UCLA, Michigan State, Texas, Oregon, Ole Miss

- Overachievers: Clemson, Oklahoma
- You were bad on multiple occasions and should feel particularly bad: UCLA, Florida State, Ole Miss, Tennessee
Like I said, this is a high watermark to meet, so it shouldn’t be surprising that only two teams’ win percentages exceeded their aggregate talent levels over this span. Clemson did so every year, and the Sooners only missed out by a percentage point in 2019. Washington and Penn State consistently tracked around or above expectations as well. Of course, Alabama and Ohio State held their own, while Notre Dame ended up about even with LSU. UCLA ranks dead last in variance between roster talent and results, showing up among the worst of the worst in each of the four seasons, while FSU isn’t far behind, having barely won half their games despite a 90% average talent level. To our collective delight, USC isn’t much better.
If we were to trim this data set to three years, the Irish would actually rank in that selective group of teams that outperformed relative to predicted team skill levels, but the 2016 season did, unfortunately, happen. They oddly ranked #10 in total talent three years in a row before dropping a few spots in 2019. There’s a rarefied air at the top of these standings, where recruiting rankings are so high (Bama sits at 99% over four years!) that it’s actually unreasonable to think that a team could consistently match it with winning percentage. Truthfully, the Irish won’t get there anytime soon. But Clemson and Oklahoma speak to the fact that programs can still steadily build and win with incoming talent that’s very, very good but not across the board elite year in, year out. There is a path to regular playoff appearances and, more importantly, contention in those games, and it doesn’t necessarily have to involve regular top five classes. Top ten, though, that sure is advisable. Good thing our head coach agrees.
